
As this year marks the 100th anniversary of the Easter Rising here in Ireland, I would like to take the opportunity to use the datasets that are made available from the year 1916 through the Central Statistics Office website. This blog post is based on my second Digital Tools and Methodologies II assignment taught by Professor Shawn Day.
The objective of this assignment is to analyse the patterns of data visualisations from the datasets that help us learn more about the underlying real world condition in which the data represent.
The procedures I undertook:
- To begin with, I have located four datasets from the Central Statistics Office website, each representing data from the years 1916 and 2014 in Ireland. The first dataset represents the birth rates, the second is death rates, the third one is the cause of deaths and finally deaths by age group.
- The four datasets were downloaded as excel files to my Dropbox.
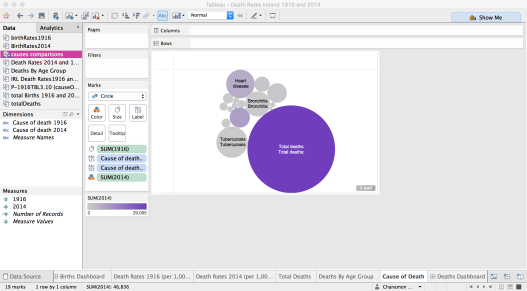
- I experimented with a few data visualisation tools such as: Gephi, Datawrapper and Tableau Public. In the end, I decided to go with Tableau Public because I find it most convenient to import the data. With Tableau Public, users get 10 GB of free storage space for all workbooks and number of rows you are limited to have per data notebook is 10,000,000 rows. Below is an example of what that the layout of Tableau Public looks like:

Tableau Sample - After that, I uploaded the excel files into Tableau Public and began connecting the data. The layouts and the colour of each visualisation were also customised.
- I created the visualisation by choosing the type of data (eg. the birth rates). The next step is to drag the field (eg. area of residence) under the ‘dimensions’ heading into the ‘Marks’ field. Continue to add the ‘measures’ into the ‘marks’ field and then choose the recommended types of visualisations such as: a pie chart, text tables, trend graphs etc.
- Next, I created two dashboards (This is where data for birth and death rates are laid out). I used the drag and drop feature to arrange the different types of interactive data visualisations from each data sheet onto these dashboards.
- Finally, I uploaded the data workbooks to my Tableau Public account. All saved workbooks are accessible to anyone on the internet.
Data Trends:
Births Registered
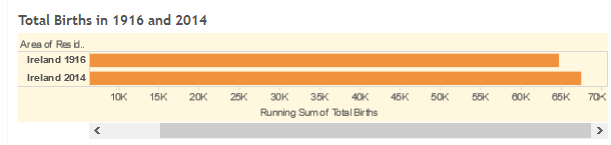
The number of births in Ireland differed from 64,814 in 1916 to 67,462 in 2014, an increase of 4% or at a rate of 0.04% for each year. The largest number of babies born for both years were all in Leinster, with the figures of 11,337 in 1916 and 28,205 in 2014 for Dublin (city and county). Ulster (part of) has the smallest number of births in Ireland for both years, with the total amount of 6,700 births in 1916 and 3,752 in 2014, a decrease of 44%. As we can see from the table above, the birth figures were rising slightly. Click here to see the data in detail.
Death Rates
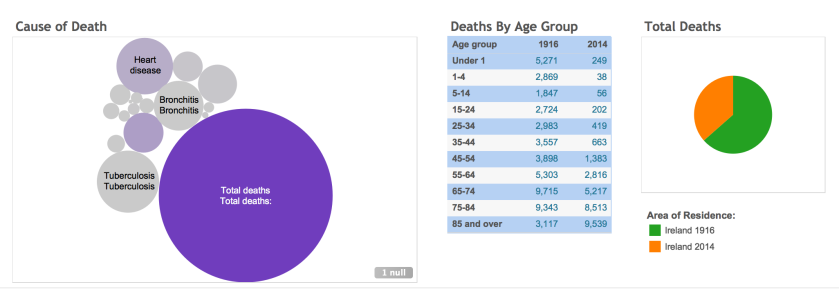
Most deaths which took place in 2014 occurred in older age groups, between age 85 and over. In comparison to this, the number of deaths in 1916 tend to spread more evenly throughout all age groups. The death figures difference in the above table for children under the age of one has decreased drastically by 95%, as the results of a decline in poverty, the onset of new medical technologies and an increased knowledge in the medical sector. 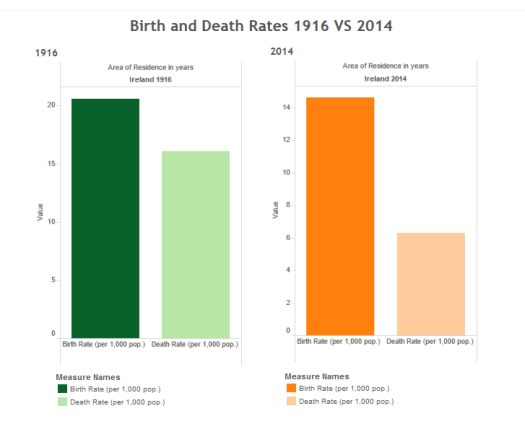
There were 50,627 deaths in 1916, with a death rate of 16.1 per 1,000 of the population in Ireland. In 2014 however, the population had risen to over 4.6 million with a sharp drop in the death rates of 6.3 per 1,000 of the population. There is a slight increase in the number of deaths from heart disease in 2014 to the sum of 6,700. Whereas the number of deaths from Tuberculosis had dropped enormously from 6,471 to 25.
CONCLUSION
As we can clearly see from the data visualisations, Ireland has changed hugely in a century. This Revolution has made Ireland a better country for the future generations. The people in 1916 were suffering greatly from Tuberculosis, Heart Disease and Bronchitis, these were the main causes of death, because they did not have the medical treatments or technology that we have today. We benefit from these new advances in medical screening and diagnostics today, which helps to reduce the number of deaths from Tuberculosis to 25 in 2014.
The people who are less well off in Ireland today no longer suffer from not being able to get medical treatments like those in 1916, as there are medical cards available to those on low income. Young infants now survive because of better sanitisation, healthy living conditions and a wide range of nourishing foods which are easily available.
Statistics
- cso.ie: Life in 1916 Ireland
- Birth Rates Statistics 1916
- Death Rates Statistics 1916 and 2014
- Vital Statistics Yearly Summary 2014
Images References:
References:


